In this Data Analytics course, you’ll dive deep into learning the best strategies and techniques for working with data using Power BI, a powerful tool that meets both business and technical needs. You’ll learn how to handle data from a range of sources, both relational and non-relational, and how to visualize and analyze that data to make informed decisions. We’ll also cover the essential skills needed to manage, deploy, and share reports and dashboards, promoting effective collaboration among teams. Whether you’re working with a business or on a technical project, this course equips you with the knowledge to leverage Power BI in optimizing data analysis and reporting processes.
At the end of this course, learners will be able to prepare and organize data for analysis. They will also be equipped to develop analytical skills, encompassing data cleaning, analysis, and visualization, using Power BI. Furthermore, learners will be proficient in creating and managing workspaces and datasets in Power BI.
At the end of this course, learners will be able to prepare and organize data for analysis. They will also be equipped to develop analytical skills, encompassing data cleaning, analysis, and visualization, using Power BI. Furthermore, learners will be proficient in creating and managing workspaces and datasets in Power BI.
Module 6: Manage Workspaces and Datasets in Power BI
Reqired Resources
Laptop, Intel Core i5 or higher, 16GB, 1TB Storage, Graphics Card (Hardware); Microsoft Power BI (Software); Adequate Internet Connection (Network)
Pre-Requisites
The audience for this course are data professionals and business intelligence professionals who want to learn how to accurately perform data analysis using Power BI. This course is also targeted toward those individuals who develop reports that visualize data from the data platform technologies that exist both in the cloud and on-premises.
Assessment
In this Data Analytics course:
One (1) diagnostic assessment is available, conducted synchronously, and focuses on knowledge-based testing. Learners have the flexibility to choose between remote or on-site participation.
Two (2) formative assessments are offered, one concentrating on knowledge and the other on performance-based skills measurement. Both formative assessments are available asynchronously, allowing learners to complete them at their own pace, with the option of remote or on-site participation.
A summative assessment in Data Analytics is centered on performance-based skills evaluation. This summative assessment is to be conducted synchronously, giving learners the choice of participating remotely or on-site.
Credit and Recognition
The learner is eligible to take the Microsoft Certified: Power BI Data Analyst Associate.
This course is facilitated by a Microsoft Certified professional. To ensure the quality of this micro-credential, continuous feedback loops with students, instructors, and industry practitioners are maintained to continually improve content, delivery, and assessment methods.
Learning Pathways
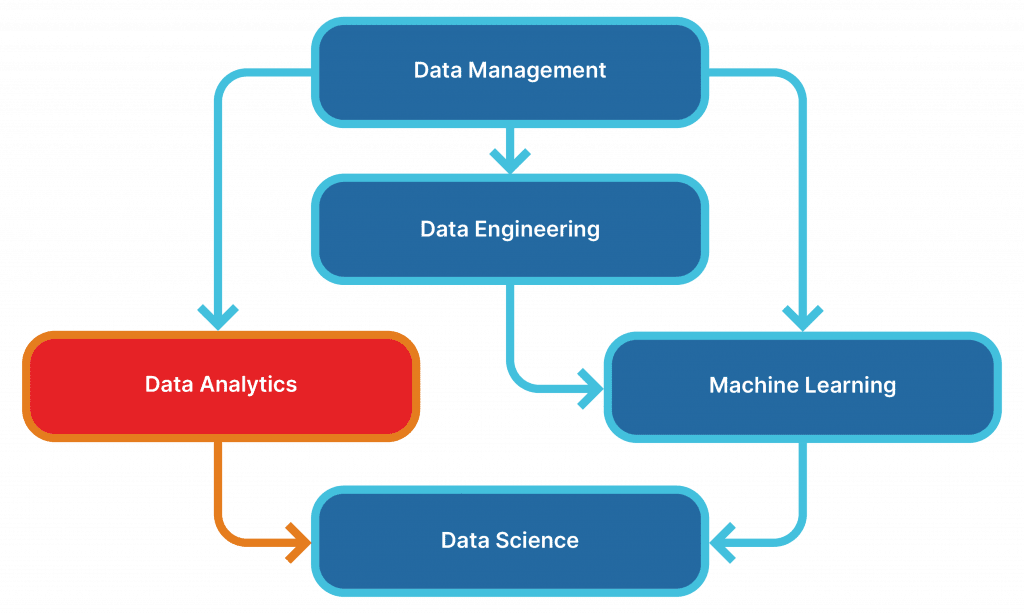
Data Analytics Path:
Data Management serves as your starting point on the path to becoming a skilled Data Analyst. This path ultimately leads to a broader understanding of data through Data Science.